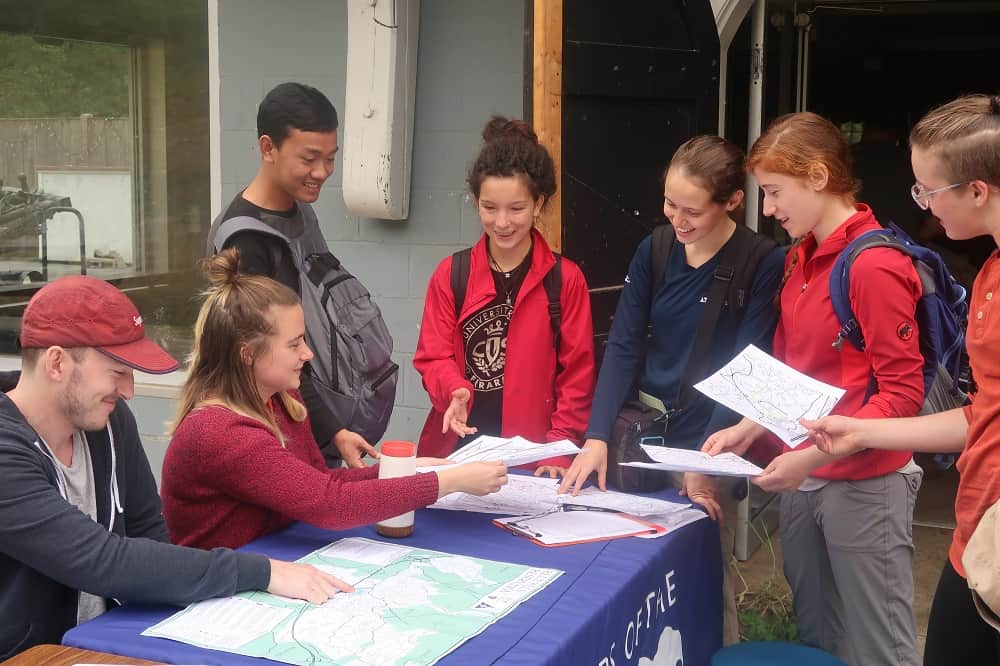
Last fall, dozens of Friends’ volunteers recorded noise levels in the Blue Hills. Volunteers emailed the noise data to Boston University researchers who created a noise map of a portion of the Blue Hills. (See below.)
The Boston University research team was led by Professor Richard Primack and doctoral student Lucy Zipf.
According to recent studies, scientists have found increasing evidence that noise pollution is harmful to the health of both humans and wildlife.
Volunteers used new cutting-edge technology that makes sound monitoring more affordable and easier to use. In the past, recording sound in such a large area would have been cost prohibitive for most researchers.
Many thanks to the volunteers for collecting valuable data that can help evaluate the quality of habitat in the Blue Hills.
 Sound map of the Blue Hills Reservation created on September 16, 2017. Mapped area is approximately 3.9 by 3.2 km. Larger, orange circles indicate higher L50 values (more noise), smaller green and blue circles indicate lower L50 values (less noise).










Do these instruments target motor noise in particular? Or are the measurements tagged to identify the source? What dB weighting? The sounds of wind or birds can be quite loud on the right day, but are not usually considered noise: how is it differentiated from pollution?
Ben, great questions! They did not identify the source. We’ll send you Dr Primack’s contact info so you can follow up with him about how it differentiates bird sounds, but I don’t think bird sounds would register as loud as automobiles.